System Usage Dashboard Widget
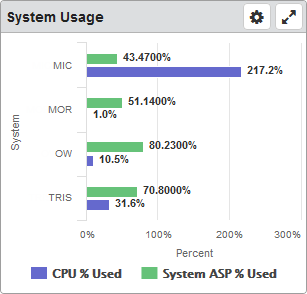
For the selected systems, this widget displays current information on both the percentage of the processor (CPU) that's being used and the percentage of the total auxiliary storage pool (ASP) that's being used.
Things you can do:
ClickTap Maximize to view the widget full-screen. ClickTap
  X to view it on the dashboard again.
If the data is in a graph:
Hover your mouse overTouch and hold the lines or bars to view information about the data.
ClickTap a data point or bar to view the Performance Details page for it.
ClickTap any item in the legend to hide or show its data in the graph.
If the data is in a table:
ClickTap a row or bar to view the Performance Details page for that data.
To change the settings:
ClickTap
 Settings on the widget.
Type a new Name, if necessary.
ClickTap Reset Name to have the software create a name based on the widget and the settings you've selected.
Note: If you're using the system-generated name, be sure to click Reset Name before saving so that a new name can be generated, if needed.
Select the display Size of the widget on the dashboard. This affects the height of the widget.
ClickTap the Auto-Refresh button to enable it (Yes) or disable it (No).
Type the number of minutes between each Auto-Refresh (Min).
Select an option under Sort By to indicate which data to use for sorting.
Select an option under Filter By to further narrow the list of items displayed.
Select Graph or Table for the data display.
Select the Systems to display.
If you select Host, Node, or Node Group, clicktap Look Up to select the systems you want.
ClickTap Save.
Note:ClickTap Delete to delete this widget from the dashboard.