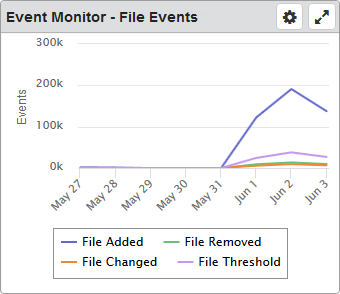
Event Monitor - File Events Dashboard Widget
For the selected system, this widget displays the number of file events (added, removed, changed, or threshold) that were monitored over a period of time. Note: You can set up event monitors using either the Robot Schedule Explorer or the IBM i.
Things you can do:
- ClickTap
 Maximize to view the widget full-screen. ClickTap
  to view it on the dashboard again.
 - Hover your mouse overTouch and hold a line to view information about the data.
- ClickTap a data point to view the Event History page for it.
- ClickTap any item in the legend to hide or show its data in the graph.
- ClickTouch and drag over an area of the graph to zoom in. ClickTap Reset Zoom to zoom back out.
To change the settings:
-
ClickTap
 Settings on the widget.
 -
Type a new Name, if necessary.
-
ClickTap Reset Name to have the software create a name based on the widget and the settings you've selected.
Note: If you're using the system-generated name, be sure to click Reset Name before saving so that a new name can be generated, if needed.
-
Select the display Size of the widget on the dashboard. This affects the height of the widget.
-
ClickTap the Auto-Refresh button to enable it (Yes) or disable it (No).
-
Type the number of minutes between each Auto-Refresh (Min).
-
Select the Date Range for the data.
-
Select the Systems to display.
If you choose Selected System, clicktap Look Up to select the one you want.
Note: For information on selecting the default system for Robot Schedule, see Select System.
-
ClickTap Save.
Note: ClickTap Delete to delete this widget from the dashboard.