In this section you will learn how to perform basic discovery in order to identify existing authorized network activity, and how to analyze this data in preparation for configuring your security implementation.
Discovery
After you have activated Powertech Exit Point Manager for IBM i, it's time to monitor your system in order to identify the servers that are reporting current network traffic and then identify the specific transactions on those servers.
Auditing Servers
To identify specific transactions you must configure Audit Flags and Capture Flags to instruct Powertech Exit Point Manager for IBM i to retain access information. After the access information has been collected, Powertech Exit Point Manager for IBM i’s Reports can be used to identify the origin and other information about each transaction. This is the information that will be used to define access control rules.
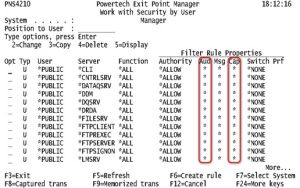
Powertech Exit Point Manager for IBM i’s default (*PUBLIC) User Rules apply to all (*ALL) Functions on all servers that permit remote access. Each is defined to inherit (*) the Audit (Aud) and Capture (Cap) values from the product's global system values.
Viewing *PUBLIC User Rules
On the
All default rules are configured to inherit the Aud value from the global System Values.
By default, Powertech Exit Point Manager for IBM i’s global Audit Flag is set to Y (retain) and the Capture Flag is set to N (don't retain) for all servers. This global setting can be configured in the Edit Product Defaults screen using the web browser interface (or the Work with Powertech Exit Point Manager for IBM i System Values panel using the green screen). This means that immediately after activation, Powertech Exit Point Manager for IBM i is configured to audit all transactions on all servers, but not to capture them for the Captured Transaction display (option 2) on the Active Analytics Menu.
Auditing and capturing all server requests can produce an overwhelming amount of data to evaluate, especially if you are unfamiliar with the amount of data your system generates. There can also be performance considerations, such as an increased frequency of journal receiver generation, and some CPU impact. To address these issues, you may decide to selectively audit and capture a smaller number of servers (by setting some servers to No and others to Yes), complete the process of adding rules to secure those servers (as described later under Adding the Initial Rule Set), and then set Audit and Capture to Yes for a different selection of servers, and repeat the process. For example, if on the Dashboard you noticed a high number of FTP transactions, you may want to focus on just those servers first. While this approach extends the overall amount of time required for a complete analysis, it also reduces the amount of data that is collected in a given period to a more manageable level.
Selecting servers to audit and capture
- From the Main Menu, choose option 1, then 2 to show the Work with Security by User panel.
- Enter 2 for the *PUBLIC rule of a server you would like to audit and capture.
- For Audit and Capture, change * to Y if you would like to audit or capture the server. Change Audit and Capture to N to specify you would not like to audit or capture the server. (Alternatively, you could change the global Audit and Capture setting to N and leave the Audit and Capture values on the servers you do not want to audit and capture to *; but, specifying this value at the server level makes it easier to reference later.)
After setting the Audit value to Yes for select servers, the next step is to allow your system time to accumulate data.
Data Collection
A common question is: “How long should I let data collection run, and how much is enough?” While auditing is never ‘complete,’ there does come a point when enough data has been collected in order to facilitate sound decisions. Because the stream of data collection may ebb and flow over time, determining the correct point in time is essential. The correct point for your organization will depend on your assessment of critical events that must be considered before audit rules can be put in place. Consider auditing over ranges of time that would show typical daily or weekly traffic patterns for your environment. It is also preferable to include periods of time with anomalies that may occur only, for example, on weekends or during month-end processing.
Audited Traffic Data for Reporting
Audit traffic is retained in Journal receivers. The default journal upon installation is the IBM-supplied journal QAUDJRN. However, you are not limited to using QAUDJRN.
Review your journal receiver retention policy. Removing the journal receivers will remove the ability to run audit reports for the date ranges the receivers cover. If the receivers are removed from the system, restoration from backups will be necessary to report over date range.
|
|
Recommendation – Use an alternate journal if QAUDJRN is not your preference. |
Initial Data Review and Analysis
Reviewing the server transaction summary
- From the Powertech Exit Point Manager for IBM i Main Menu, choose option 4.
- If the Legacy Reports menu appears, press F11 to switch to the Modern Reports Menu.
- Press 4 to open the Extract Audited Transactions panel.
- Press F9 to show all parameters.
-
For Report Style, enter *SUMMARY to generate a summary by server only.
- Press Enter to run the report. You return to the Reports Menu.
- Enter WRKSPF to open Work with All Spooled Files panel.
- Choose option 5 for PNS4100P to display the report.
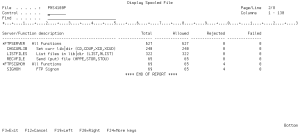
The summary of transactions on audited servers is a starting point for planning your security configuration.
Your audit results may not show traffic on each of the audited servers. A typical system will show activity on 12-15 servers with the heaviest activity on 6-8 servers. Some may not be used at all in your environment. (If you don’t see traffic, remember it is also possible your system did not generate activity during the captured time range). If a server is not being used, it can be blocked to prevent all access, accidental or malicious.
For your initial review, you can identify the servers with and without activity in a general transaction summary. To do this, run a report that displays all transactions on all the servers you are auditing.
Reviewing Server Transactions
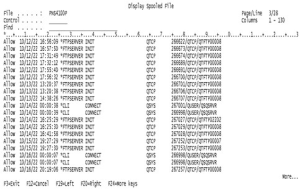
Now that your server summary has revealed the servers that are being used, you can review the transaction history on those servers to identify unauthorized activity or automated service profiles that do not require auditing.
Reviewing server transaction activity
- On the Modern Reports menu, press 4 to open the Extract Audited Transactions panel. Specify the transactions you would like to identify. For example, for Include Server, you would enter *FTP* if the transaction summary indicated transactions over the FTP server.
- Page down to show the Occurrence Period parameter, and specify the desired time period. For the first report, a week is usually a reasonable duration (*THISWEEK). Also specify the starting day in the First Day of Week field.
- Press F9 to show all parameters.
- For Report Style, enter *SUMMARY to generate a summary by server only.
- Press Enter to run the report. You return to the Reports Menu.
- Enter WRKSPF to open Work with All Spooled Files panel.
- Choose option 5 for PNS4100P to display the report.
Now that you have discovered the servers with activity, and identified the users and transactions on those servers, you can begin implementing your security configuration by defining your own custom access control rules.


