Using Logs
Overview
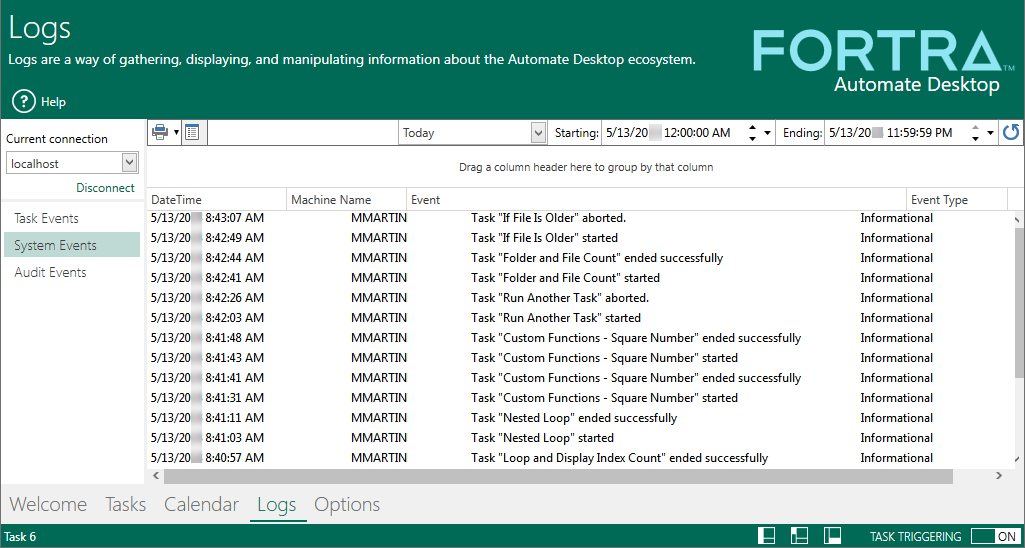
Automate Desktop maintains text logs that record various events which can be viewed from the Logs section of Task Administrator. These logs contain a complete set of table formatted reports that display the status and condition of tasks, triggers, system related events and various other operations. You can view statistics, such as whether a task ran successfully or failed, the date/time a task started and ended, which computer ran the task (helpful when deploying tasks to remote agents), when a task was created, deleted or updated, and much more.
Automate Desktop's enhanced sorting and filtering capabilities lets you display the list of records in a particular order and view only those records that meet a specific criteria. For precise filtering, an intuitive Filter Editor can be used to define filter criteria using an unlimited number of conditions combined with logical operators. Records can be grouped by one or more columns. When data grouping is applied by multiple columns, data rows are organized into a tree hierarchy. Logged events can be exported to various file types, including TXT, XLSX, CSV, PDF, HTML as well as a variety of image formats. In addition, enhanced print features enable you to generate numerous reports with ease. The System Events log is displayed below.
Sorting events
To sort data against a column or to change a column's sort order, click its header. The column's current sort order is indicated by the sort glyph (a small arrow displayed at the column header's right edge). If the data is sorted in ascending order, the sort glyph represents an up-arrow. When sorted in descending order, the sort glyph is displayed as a down-arrow.
Sorting rows by a column's value
-
Click a column's header. An Up or Down arrow appears at the column header's right edge.
-
Click the arrow to sort records in ascending or descending order. An Up arrow indicates an ascending sort order and a Down arrows indicates a descending sort order.
If sorting isn't applied, clicking the column's header sorts data by its values in ascending order. If sorting is already applied to the column, subsequent clicks reverse the current sort order. A regular click on a column header clears the sort settings on any other columns. To preserve the existing sort settings of other columns, hold the SHIFT key down while clicking. This can be useful when it is needed to sort against multiple columns.
Grouping events
The Group panel provides a section directly above the column headers in which a column can be dragged onto in order to group by that column. Numerous columns can be dragged for additional grouping. When a view is grouped by a single column, data rows that have identical values in this column are arranged into groups. Each group is identified by a group row. If the view is grouped by additional columns, data rows within each group are arranged into second level groups based on the values of the new grouping column, etc. Group rows are used to organize data rows into a tree when data grouping is applied.
To group by a column
Perform one of the following:
-
Drag a column header from the column header panel to the Group Panel (as shown below).
-
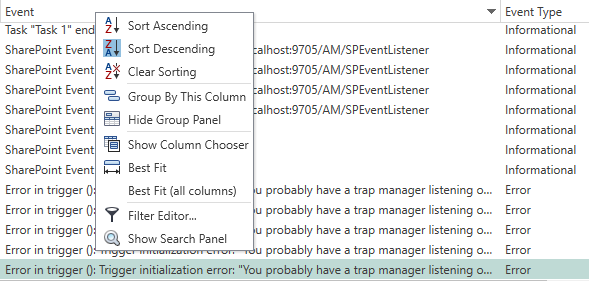
Right-click a column header and select Group By This Column from the shortcut menu (as shown below). To remove grouping, right click the group panel and select Clear Grouping.
Filtering data
A log table can be filtered in numerous ways, however, filter options may vary depending on the report. The most common filters are shown below. In addition, a Filter drop down is available for column filtering and a Filter Editor is available for those who prefer a more comprehensive filtering.

To filter events
The Columns![]() icon allows you to filter the columns to be included in
the report. To filter by columns, select the Columns
button, and then select/deselect the desired columns.
icon allows you to filter the columns to be included in
the report. To filter by columns, select the Columns
button, and then select/deselect the desired columns.
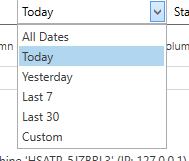
To filter by predefined date range
-
Click the predefined date range list located on the Filter bar.
-
Select a predefined date range to use it as a filter.

To filter by custom date range
In the Starting or Ending box, select the down arrow to display the calendar/time controls to set the date and time.
To filter by task or group of tasks
-
The Tasks drop-down defaults to All Tasks which will display all task events. Click this to show the list of managed folders/tasks.
-
Select a folder to filter only tasks that reside in that folder or select an individual task as a filter.

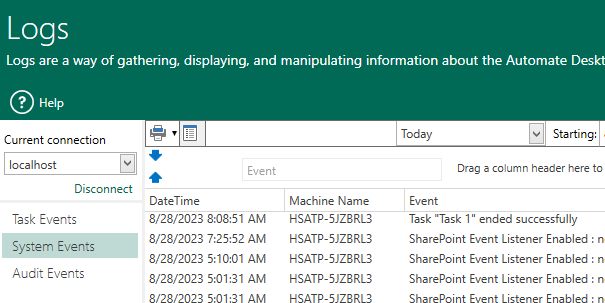
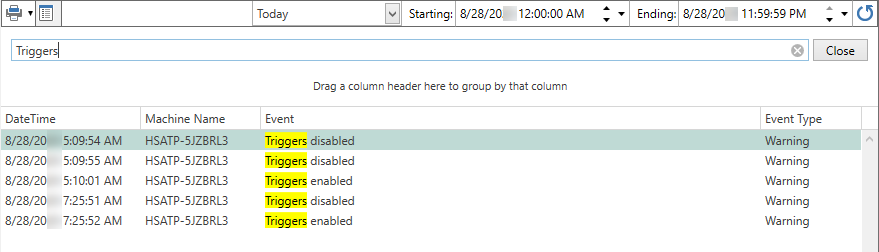
To filter by keyword by the way of the search panel
-
Open the search panel by right-clicking any column header and selecting Show search panel from the shortcut menu that appears.
-
Enter all or part of the keyword you want to search for. The list of events that contain matching text are populated as you type each letter, with matching characters highlighted for ease of detection (as shown below).
-
To hide the search panel, click the Close button located to the right of the search box or right-click any column header and select Hide search panel.

Filter by column data
-
Hover your pointer over a column header, and then select the Filter icon that appears.

-
Select the column data to include in the report from the list.
Using the Filter Editor
The Filter Editor allows you to build complex filter criteria with an unlimited number of filter conditions combined by logical operators. To open the Filter Editor, right-click any column header, and then select Filter Editor. The Filter Editor displays filter criteria as a tree structure, where nodes represent simple filter conditions. If the filter criteria consists of multiple filter conditions, the Filter Editor contains multiple nodes linked by logical operators.

Printing and exporting
Selecting the Print/Export![]() icon opens the Print Preview window which displays
a document's preview area and provides a toolbar that allows you to
navigate, zoom, print, or export the document. Selecting the Export
icon opens the Print Preview window which displays
a document's preview area and provides a toolbar that allows you to
navigate, zoom, print, or export the document. Selecting the Export or Send
![]() icons allows you to export/send the report in a variety
of file formats. While a document is being generated, its progress
is reflected in the status bar.
icons allows you to export/send the report in a variety
of file formats. While a document is being generated, its progress
is reflected in the status bar.
Commands and operations
Right-clicking a particular column header presents the menu shown below which supplies more filtering options.
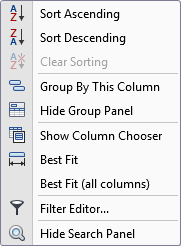
The following table describes each menu item:
| Menu Item | Description |
|---|---|
| Sort Ascending | Sorts the selected column in ascending view. |
| Sort Descending | Sorts the selected column in descending view. |
| Clear Sorting | Clears all sorting and returns all columns to default view (Enabled only when sorting is used). |
| Group by this column | Puts the selected column into a group. Numerous columns can be grouped for added filtering. |
| Hide group panel | Hides a displayed group panel. |
| Show column chooser | Displays a dialog titled Column Chooser allowing you to drag columns into in order further customize the current layout. |
| Best fit | Provides the best fit for the selected column. |
| Best fit (all columns) | Provides the best fit for all columns. |
| Clear Filter | Clears all filters (enabled only when filters are used). |
| Filter Editor | Opens a dialog titled Filter Editor permitting more detailed filtering options. A multitude of conditions are available allowing for practically any type of filter to be included. |
| Show/hide search panel | Displays the search panel allowing more detailed filtering by keyword. To hide a search panel currently on display, select Hide search panel. |