Statistics - Job Monitors Dashboard Widget
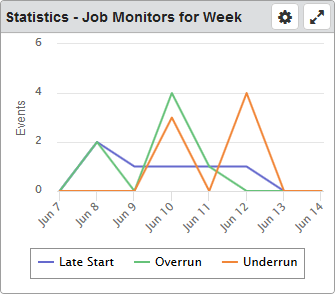
For the selected system or critical job list, this widget displays the number of monitored events (job overrun, underrun, and late start) that occurred each day over a period of time. Note: You can add a monitor to a job when you add or edit the job in Robot Schedule - either in the Explorer or on the IBM i.
Things you can do:
- ClickTap
 Maximize to view the widget full-screen. ClickTap
  to view it on the dashboard again.
 - Hover your mouse overTouch and hold a line to view information about the data.
- ClickTap a data point to view the Job Monitor History page for it.
- ClickTap any item in the legend to hide or show its data in the graph.
- ClickTouch and drag over an area of the graph to zoom in. ClickTap Reset Zoom to zoom back out.
To change the settings:
-
ClickTap
 Settings on the widget.
 -
Type a new Name, if necessary.
-
ClickTap Reset Name to have the software create a name based on the widget and the settings you've selected.
Note: If you're using the system-generated name, be sure to click Reset Name before saving so that a new name can be generated, if needed.
-
Select the display Size of the widget on the dashboard. This affects the height of the widget.
-
ClickTap the Auto-Refresh button to enable it (Yes) or disable it (No).
-
Type the number of minutes between each Auto-Refresh (Min).
-
Select the Date Range for the data.
-
Select the Systems to display.
If you choose Selected System or Critical Job List, clicktap Look Up to select the one you want.
Note: For information on selecting the default system for Robot Schedule, see Select System.
-
ClickTap Save.
Note: ClickTap Delete to delete this widget from the dashboard.