Creating Charts
Intermapper charts display the history of one or more variables. This information can also be saved to a log file for further analysis.
- Open one of the status windows as described in Viewing Status Windows.
- Drag the status window to create a new window.
- Click any of the underlined values. If the underlined value is displayed on existing charts, a list of charts is displayed, along with a Create Chart option.
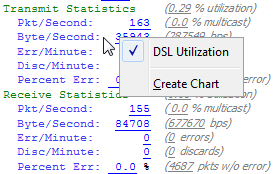
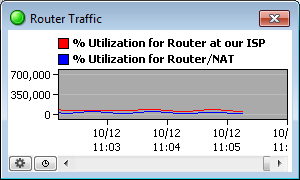
- Click Create Chart. A new chart is displayed.
- To add more variables to the chart, drag underlined values to the chart. For example,
For more information on charts, see Using Charts.