Using Charts
Intermapper displays historical information in a chart. Charts can hold an unlimited number of datasets for an unlimited time period. This data can also be written to a tab-delimited text file.
A chart is a persistent window that belongs to a particular map. All data that is displayed in a chart must come from devices or links of that map.
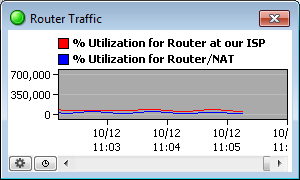
The figure on the right shows a chart with two variables. You can control its labels, axes, options, and time intervals, as described in the pages of this section.
Use the options available from the Charts Menu (Pg. 1) to view and hide charts.
Use the options available from the Chart Options (Pg. 1) menu to view and edit the parameters which control content and appearance of each chart.
You can also specify the file that logs the chart's data, and control options for creating new chart log files. For more information, see Chart Log Files (Pg. 1).
Viewing and Hiding Charts
You view and hide charts using the Charts command in the View menu or by selecting options from the Charts menu at the bottom left of the chart's window. (Pg. 1).
To show an existing chart, do one of the following:
- Click
 in the tool bar to view a list of charts associated with the map.
Double-click a chart to view it.
in the tool bar to view a list of charts associated with the map.
Double-click a chart to view it.
- Right/Ctrl-click
in the tool bar to view a menu of charts associated with the map without changing to the Chart List view. From the menu, select a list.
- From the Chart List view, right-click or Ctrl-click a chart and select Show Chart.
To hide a chart:
Click the close box. The chart is hidden, but the chart's data is preserved and continues to be collected.
To scroll the chart:
Drag the chart background to scroll the chart right or left.
Creating and Adding Datasets to Charts
To create a chart:
- Open one of the Status windows as described in Viewing Status Windows (Pg. 1).
- Drag the Status window to create a new window.
- Click any of the underlined values. If the underlined value appears on existing charts, a list of charts is displayed, along with a Create Chart option.
- Click Create Chart. A new chart is displayed.
To add a dataset to an existing chart:
- Open a Status window.
- Drag an underlined value (blue or grey) from a status window into the chart. The variable is added to the chart.
Editing Charts
Edit the parameters that control a chart's content and appearance from the Chart Options window (Pg. 1), available from the Chart menu (Pg. 1).
Deleting Charts
Use the Delete Chart command, available from the Chart menu (Pg. 1) to delete a chart.