Chart Defaults
Charts can show historical data for values received from one or more devices. You can use the Chart Defaults panel of the Server Preferences section of the Server Settings window to view and edit the default settings for a newly-created chart. For more information, see Creating Charts (Pg. 1) and Using Charts (Pg. 1).
To view and edit Chart Default preferences:
- From the Edit menu, select Server Settings. The Server Settings window is displayed, showing the list of available settings. Selected settings are displayed on the right.
- Click Chart Defaults. The Chart Defaults panel is displayed in the right panel of the Server Settings window.
Axes Tab
You can use the Axes Tab of the Chart Defaults panel to define the appearance and behavior of newly-created charts.
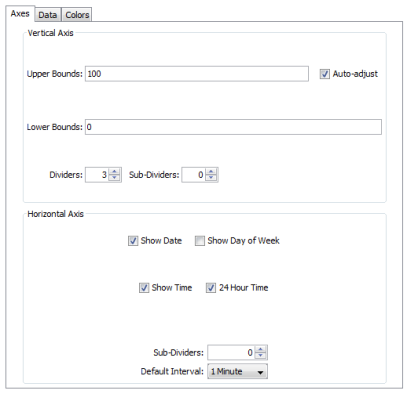
Upper Bounds, Lower Bounds - Controls the vertical scale of the chart. The range of values depends on the variable being monitored.
Auto-adjust - Specifies if Intermapper adjusts the scale of the chart automatically. If the Auto-adjust check box is selected, the upper and lower bounds are adjusted automatically so data points are always displayed, no matter how much they increase or decrease.
Dividers, Sub-Dividers - Click the up and down arrows or enter the number of dividing lines to set the number of horizontal dividers and to set the number of sub-dividers you want to appear between the dividers. For example, set the number of dividers to 3 and the number of sub-dividers to 4. This gives a total of 11 dividers. (Three dividers - top, bottom, and center, with four dividers between each. Eight subdividers and three dividers.)
Show Date, Show Day of Week, Show Time, 24 Hour Time - Select or clear these check boxes to specify which labels appear on a chart's horizontal axis by default.
Default Interval - Use the menu to select a default interval between timestamps on the X-axis (horizontal) of new charts. Shorter intervals show finer detail; longer intervals show a longer history.
Sub-Dividers - Click the up and down arrows to specify the number of vertical sub-dividers to draw between data points.
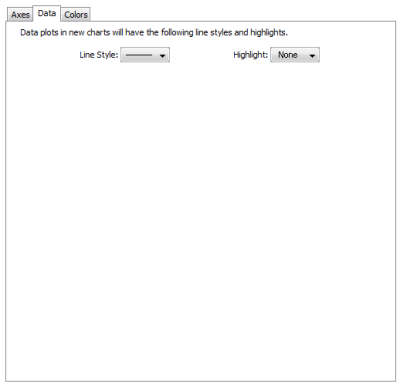
Data Tab
You can use the Data tab of the Chart Defaults panel to specify line and data point styles.
|
|
Style Use the Line Style menu to specify a line thickness
for the
Highlight Use the Highlight menu to select the icon to be drawn at the end of each line segment.
|

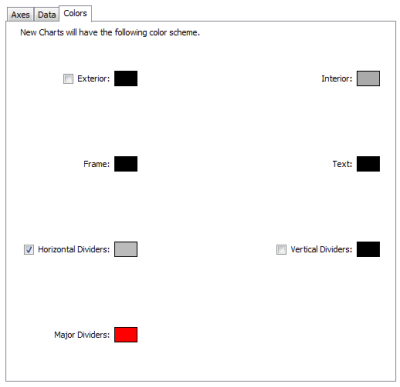
Colors Tab
You can use the Colors tab of the Chart Defaults panel to specify line and data point styles.
|
|
To change a color: Select a color. A color-selection window is displayed. For more information on colors and how they are used, see the Colors Tab (Pg. 1) section of Chart Options. |