Understand Scan Activity
The Scan Activity page (located by selecting Scans > Scan Activity on the navigation menu) shows you recent scans conducted on your network.

| Ref. | Description |
|---|---|
| 1 | Scan name and its associated business group. |
| 2 | Scan Status. |
| 3 | Number of scanned web applications. |
| 4 | Time the scan started and its duration. |
| 5 | Opens the Create New Scan pages. |
| 6 | Options to search and filter. |
| 7 | Sort scans by web app count, date finished / started, name, scan locations, status and workflow. |
| 8 | Options to Delete, Rerun, and view the Results of a scan. |
View Scan Results
Scan results are produced if a scan completes successfully, is canceled, or terminates because of an error.
On the Scan Activity page, select a scan name to view its results.
There are several tabs (Overview, Assets, and Vulnerabilities) that show you information as is seen on the Active View Overview, Assets, and Vulnerabilities pages, but the data is related only to the scan you are viewing; not your entire organization.
A scan results page allows you to perform the following actions no matter what tab you are on:
- Delete: Deletes the scan. If it is a one-time scan, this option not only deletes the results, it removes the scan entirely from Fortra VM.
- Rescan: Rescans All assets now (reruns the scan immediately; the scan name is appended with Rescan, Rescan 2, etc.) or All assets custom … (lets you modify scan settings, except the Business group, before rerunning it).
- Build Report: Opens the Build Report dialog.
See related: Reports
Details Tab
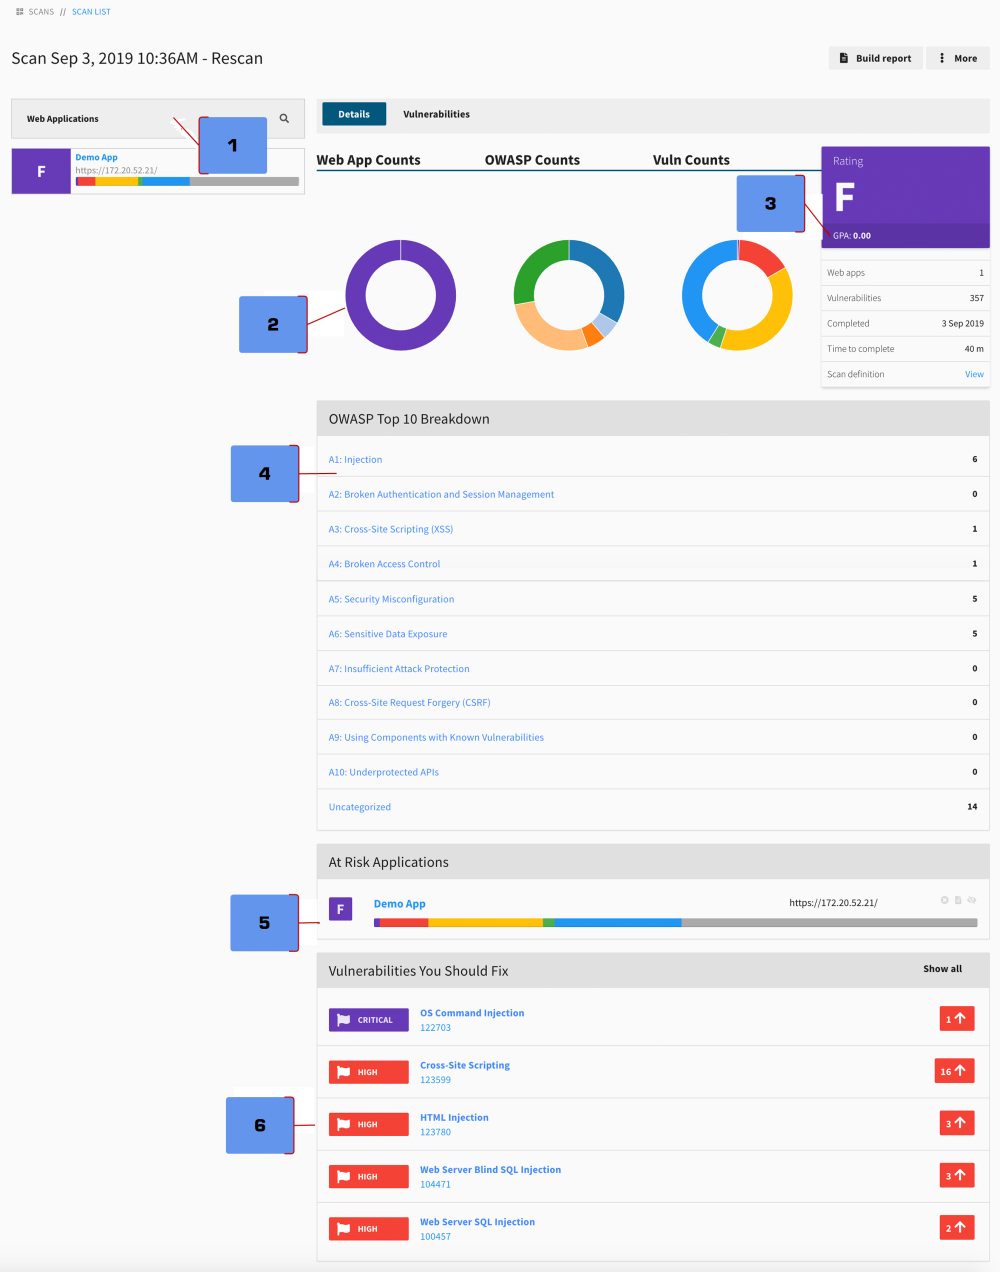
This tab provides the following panels that give you general information about what the scan discovered.

| Ref. | Description |
|---|---|
| 1 |
The Web Applications Sidebar provides a search-able and click-able list of the web applications included in the scan, along with their Security GPA for the scan. Select a web application to view its pages and details. See related: Active View and Active View |
| 2 |
Web App Counts A doughnut chart that helps you compare the Security GPA of each web app included in the scan. Hover over a Security GPA to see the number of web apps, and select it to go to the Vulnerabilities tab and see expanded data filtered by the selected Security GPA. This will show all vulnerabilities for all web apps that received that Security GPA. OWASP Counts A doughnut chart that helps you compare the OWASP Top 10 vulnerabilities. Hover over an OWASP Top 10 vulnerabilities to see how many instances there are, and select it to go to the Vulnerabilities tab and see expanded data filtered by what you chose. Vuln Counts A doughnut chart that helps you compare vulnerability severity levels (e.g., Critical, Trivial). Hover over a severity level to see how many there are, and select it to go to the Vulnerabilities tab and see expanded data filtered by what you chose. |
| 3 | Provides a summary of your scan, including its Security GPA. |
| 4 |
Displays the number of vulnerabilities in your environment that fall under each OWASP Top 10 risk. See related: OWASP Top 10 Breakdown |
| 5 |
Shows the top-five most vulnerable web applications. See related: At-Risk Applications |
| 6 |
Shows the vulnerabilities that most need your attention. See related: Vulnerabilities You Should Fix |
Web Application Scan Details
Select a web application from the Web Applications Sidebar to view its pages and details for the scan. This tab provides information similar to what is on the Active View: Web App Details page, but the data is limited to the scan you are viewing.
To understand what you can see and do here, see Web App Details
Vulnerabilities Tab
This tab provides information similar to what is on the Active View Vulnerabilities page, but the data is limited to the scan you are viewing.
To understand what you can see and do here, see Vulnerabilities.