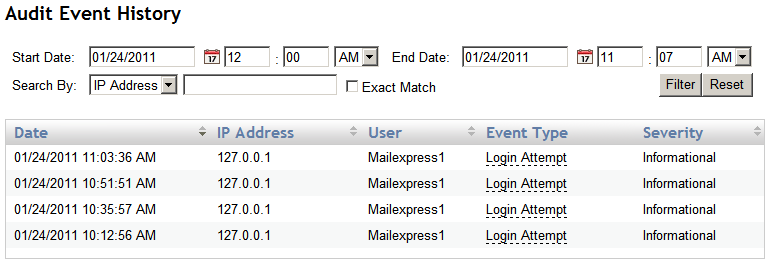
The Audit Event History report displays all events that occurred on the Mail Express server within a particular date range. The report displays the IP address from which the event initiated, the user who caused the event, the type of event, and the severity of the event. The severity level can be any one of the following types:
Informational - The default severity level for most events. Denotes an event that is expected under normal operation.
Warning - Denotes system issues that are recoverable.
Error - Denotes system issues that are not recoverable.
In the Event Type column, you can place your cursor over the event to view a tool tip about the event. For example, for an invalid login, the User column is empty and the Event Type column displays Login Attempt. When you place your cursor over Login Attempt, a "What's this?" cursor appears and the tool tip displays "Login attempted for [username] from [IP address] successful? [false]."

Refer to Audit Event Types for details of the various types of audit events in the Event Type column.
For details of generating reports of activity, configuration changes, or users, refer to Generating Reports of Mail Express Activity, Viewing Configuration History, and Viewing User History.
To view the database schema, refer to Mail Express Database Tables.
To view audit event history
Launch the Mail Express Server administration interface. (e.g., click Start > Programs > Globalscape > Mail Express > Mail Express Admin or double-click the desktop shortcut).
Log in using the Mail Express Server administrator username and password that you specified during installation of the server.
In the navigation pane, click Auditing > Events. The Audit Event History report page appears.
In the Start date boxes, specify the beginning date and time of the report range. (Reports default to a minimum start date of the Mail Express Server installation date.) Click the calendar icon to select a date from a popup calendar.
In the End date boxes, specify the end date and time of the report range. Click the calendar icon to select a date from a popup calendar.
(Optional) In the Search by boxes, click the down arrow to filter by IP Address, Severity, Event Type, or User, then in the box specify the IP address, severity, event type, or user by which to filter the date. Select the Exact Match check box to display only those items that exactly match your filter. For example, to display all users that contain the letter j, in the Search By box, click User, then type a j in the box. The report will display all usernames that contain the letter j (kjomalley, jsmithson, bjones, etc.). To display only a specific user, click User, type the username in the box, then select the Exact Match check box.
Click Filter. The report updates with your search and filter selections. Click Reset to clear the filter criteria.

Click any column header that has an up/down arrow to sort the data ascending or descending.
Place your cursor over a row in the Event Type column to view more information about the event. For details of Event Type, refer to Audit Event Types.