Flows Window
You can use the Flows window to view and analyze traffic at a very detailed level.
Intermapper Flows acts as a NetFlow/sFlow collector. The Flows window provides a view of Flows data collected from supported hardware and software exporters.
To open the Flows window:
- See all Flows data - From the Map List window, right-click or Ctrl-click a server and select Flows Window. This is an unfiltered view of your Flows data and no filters are set.
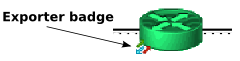
- See Flows data for a specific exporter's interface - Right-click or Ctrl-click a link on a device that shows an exporter device badge and select Show In > Flows Window. The Exporters filter is set to the selected exporter.
NOTE: The Exporter badge is displayed for any device that is in the list of Flows exporters. For more information, see Flows Settings - Exporters Tab.
- See all Flows data for a device - Right-click or Ctrl-click a device and select Show In > Flows Window. The Device filter is set to the selected device. If the device has the same IP address as an exporter, that exporter is selected in the Exporters filter and only data for that exporter is displayed.
For more information on filters, see Filter Tools below.
Understanding the Flows Window
You can use the Flows window to view Flows data.
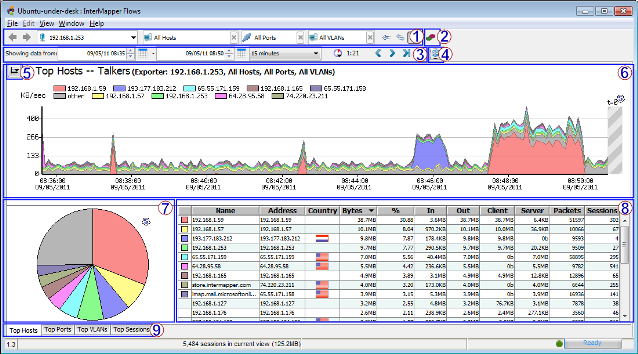
When you first open the Flows window, the Hosts tab is selected. From the Hosts tab, do the following:
- 1: Filter tools - Select the subset of Flows data to view.
- 2: Intermapper Flows Settings - View and edit Intermapper Flows settings.
- 3: Time Range Selection tools - Select and navigate Flows data over a specified period.
- 4: Refresh button - Click to refresh the current view of Flows data.
- 5: Set Graph Scale - Select a scale to use for viewing data in the stack chart.
- 6: Stack Chart - View current host, port, or VLAN data in a stack chart.
- 7: Hosts, Ports, or VLANs pie chart - View current host, port, or VLAN data as a percentage of total data flow in a pie chart.
- 8: Hosts, Ports, or VLANs list table - View details about a specific host, port, or VLAN.
- 9: Page Selection tabs - Click a tab to select a Flows window page.
Click a tab to select one of the following Flows window pages:
- Top Hosts tab - View a list of top talkers, listeners, or both, with stack and pie charts showing the relative activity of each.
- Top Ports tab - View a list of ports with the highest activity, with stack and pie charts showing the relative activity of each.
- Top VLANs tab - View a list of VLANs with the highest activity, with stack and pie charts showing the relative activity of each.
- Top Sessions tab - View a list of sessions, with start and end IP addresses and the start and end time of each session.
Flow Type Icons
When collecting data from NetFlow and sFlow exporters, you can see what kind of exporter the data is coming from.


|
NetFlow Data | This icon is shown when viewing data from a NetFlow exporter. Depending on the version, the icon shows a 1, 5, 7, or 9. |

|
sFlow Data | This icon is displayed when viewing data from an sFlow exporter. |
|
|
J-Flow, CFlow | These exporters implement a Flows format that is identical to NetFlow v5, so they appear as NetFlow v5 in the Flows window. |
Filter Tools
You can use the filter tools to view a subset of the data, selecting from available exporters, talkers, listeners, ports, or sessions collected by Intermapper Flows.

|
Previous/ Next view |
Click the left arrow to view the current tab with a previous set of filters. If you clicked a previous set of filters, click the right arrow to view the current tab with the next set of filters in the view history. |
|
Exporter | Select a different exporter from the menu to view traffic from that exporter. You can also select a specific interface on an exporter from the menu. |
|
Host | Enter an IP address or subnet (x.x.x.x/#) to view traffic from that host or subnet or select from the menu. Type an exclamation point (!) to exclude the specified host. |
|
Port | Enter a port from the menu to view traffic from that port or choose from the menu. Type an exclamation point (!) to exclude the specified port. |
|
VLAN | Enter a VLAN number in the box to show Flows activity for only that VLAN. Type an exclamation point (!) to exclude the specified VLAN. |

|
Talkers/ Both/ Listeners |
Click the left arrow to view Top Listeners (receivers) only, the right arrow to view Top Talkers (senders) only, and the button with both arrows to view Top Hosts by the total traffic sent and received by each host. |
| Context Menu |
Right-click or Ctrl-click an area of host activity in the Stack chart, Pie chart, or list and choose from the context menu. The menu changes depending on which area of the window you right-click. Get more detail in the Top Hosts, Top Ports, or Top Sessions tab. |
|
|
Exclude Host/Port/VLAN |
Type an exclamation point (!) to negate a filter, or right-click (Ctrl-click) a host, port, or VLAN in the pie chart or graph and select Exclude. Negated filters are shown with green border. |
Time Range Selection
You can use the time range selection controls to view and select a range of time for which you want to view.

To select a time range:
- Select by dragging across an area of the stack chart.
- For precise control, enter times in the Showing data from Start and End time fields.
- Click the calendar icon to set a Start or End date.
- Use the menu to select a preset time range. When you change this value, the current End time is preserved.
- Use the time navigation controls shown below to jump back or forward by the amount shown in the time range menu or jump to now.

|
Back in Time | Click the left arrow to view the previous page of data. The amount of data shown is determined by the current setting of the time range menu. |

|
Forward in Time | Click the right arrow to view the next page of data. The amount of data shown is determined by the current setting of the time range menu. |

|
Forward to Now | Click Now to view the latest data. The amount of data shown is determined by the current setting of the time range menu. |

|
Zoom Out | Click Zoom Out to reset the time range to the most recent setting in the Time Range menu. |

|
Refresh | Click Refresh to view the most recent data, based on the setting of the time range menu. |

|
Auto-refresh Interval | Select a refresh interval from the Auto-refresh menu. |
| Time until refresh | The time to the right of the Auto-refresh Interval button indicates the time until the next refresh of the window. |
Reports and Settings
| Save... | Select this command from the File menu to save a PDF report to disk. A standard file dialog is displayed. The report contains the Top Hosts, Top Ports, and Top Sessions tabs. | |
| Print... | Select this command from the File menu to print a report using the current time range and filter settings. A standard print dialog is displayed. | |

|
Open Settings Dialog | Click this button to open the Intermapper Flows Settings dialog. For more information, see the Intermapper Flows Settings topic. |