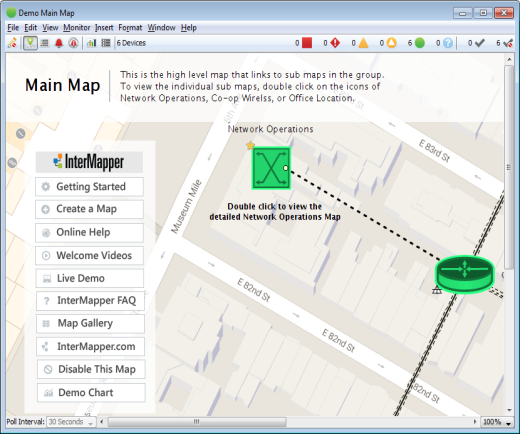
Map Window
You can view any map in a Map window. The following example shows maps installed with Intermapper.
For an in-depth explanation of the elements that appear in the map window, what they mean, and how to use them, see Monitoring Your Network (Pg. 1).
Title Bar
The Title bar shows the map's title, state, and standard controls for zooming, minimizing, and closing the window.

Menu Bar
The Menu bar contains the map menus.

For more information on each menu, see the Command/Menu Reference (Pg. 1).
Toolbar
The Toolbar contains buttons to toggle the edit mode and to switch from one view to another.
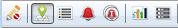
Switching Between Monitor Mode and Edit Mode
Click Lock at the left end of the tool bar to switch the map between Monitor mode and Edit mode:

|
In Monitor mode - The map is not editable and status windows appear when you click and hold a device, link, or network. |

|
In Edit mode - The map is editable. Status windows can be opened with menu commands. |
Press Tab to switch between Monitor and Edit modes.
Switching Views in the Map Window
Click one of the following buttons to switch to a different Map Window view:
|
|
Map view - Shows the map graphically, showing devices, networks, and their interconnections. |
|
|
List view - Shows the devices on the map as a list, with columns for the device status, name, address, probe type, and current and previous condition.
NOTE: You can also view a global list of devices.
To view a global device list:
|
|
|
Device Notifiers view - This view allows you to see which notifiers are attached to each device on a map. Another way to think of it is as a responsibilities view - what devices does a certain notifier apply to.
|
|
|
Link Notifiers view - This view allows you to see which notifiers are attached to interfaces on a map.
|
|
|
Chart view - Shows the list of charts for the map.
|
|
|
Dataset view - This view shows the datasets available for charting and data collection in this map. With the map in edit mode, you can choose a retention policy for any dataset. This view shows the following:
|


Choosing and Sorting Columns in List Views
Use the Choose/Sort menu (click ![]() , upper right corner of the list) or the Columns and Sort menus in the View menu to select which columns you want to view and the order in which you want to sort the list.
, upper right corner of the list) or the Columns and Sort menus in the View menu to select which columns you want to view and the order in which you want to sort the list.
- Select or clear a check box from the Choose/Sort menu in the upper right of the window or pane to include or exclude a column.
- Use the Sort submenu to select the column you want to sort by.
- Click a column heading to sort by that column.
- Click again to sort in reverse order.
- Use the Columns submenu in the View menu to select the columns you want to view.
- Use the Sort submenu in the View menu to select the column you want to sort by.
Map Legend
The Map legend to the right of the toolbar shows the different states of the map and the number of devices in each state. It also acts as a filter in list view.
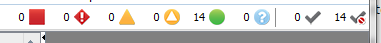


- Click a legend icon to view a list of devices that are currently in that state.
- Click the icon again to return to the previous view.
-
Shift-click icons to view devices in more than one state.
EXAMPLE:Shift-click the Alarm and Warning icons to see devices in either of those states.
- Click one of the Acknowledge Filter buttons (to the right of the legend) to list acknowledged or un-acknowledged devices. NOTE: The filter buttons work with the legend icons. Clicking Filter shows only the devices in the selected state that are acknowledged or un-acknowledged. It is possible to click Filter and see no devices.
Map Area
The Map area is the canvas where you create your map. To get started, look at Creating Maps for information on starting your map (Pg. 1). The Creating Maps section provides information on creating (Pg. 1), arranging (Pg. 1) and making your map look just the way you want (Pg. 1) it to look. You can also find a quick reference of editing shortcuts (Pg. 1).
For an in-depth explanation of the elements that appear in the map window, what they mean, and how to use them, see Monitoring Your Network (Pg. 1).
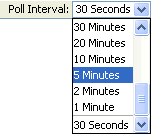
Status Bar
The Status bar contains controls for switching in and out of map edit mode, setting the polling interval, and zooming in and out of the map.

| The Poll Interval menu sets the polling interval for the map. |
|
| The Map Zoom menu sets the zoom factor for the map. If you selectAuto, the map zooms automatically when you resize the window. |
|