The Workspace and Console
Every penetration test in Core Impact is run within a new or existing workspace. A workspace is a place where information regarding a specific test is stored. See Workspaces and Teaming for more detailed information about workspaces and the New Workspace Wizard as well as how to create Teaming Workspaces.
The Console
After creating a new, or opening an existing workspace, the Core Impact Console appears. The Console is the main window that you will use to start scans, launch attacks, and manage agent activity. The six panels that make up the Console are described in detail below.
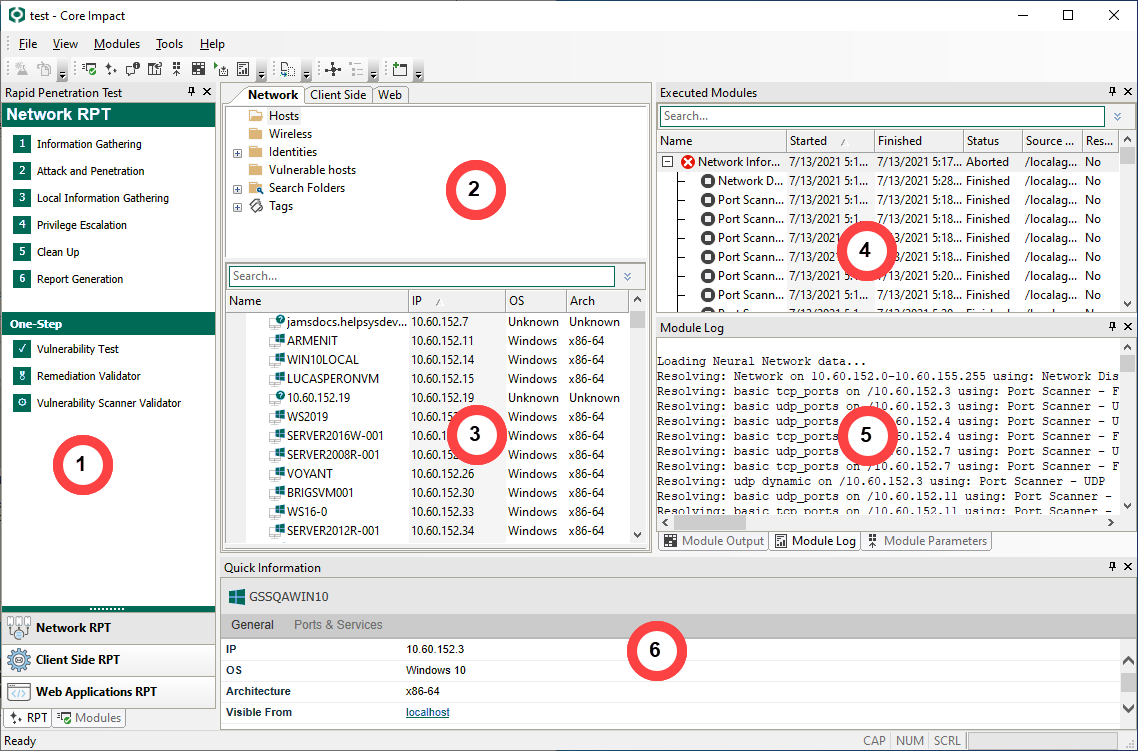
figure 2 - Core Impact Console
-
The Modules Panel. Provides access to Core Impact Modules. Modules are the actions you can perform during a penetration test. This panel has two views, Rapid Penetration Test (RPT) and Modules, accessed by corresponding tabs at the bottom of the panel. The steps in the RPT view are high-level actions that can be used to execute an automated penetration test. See Rapid Penetration Test (RPT) or Working With Modules for a detailed description of this panel and modules in general.
-
The Entity View Panel. Displays information about the target hosts, users, or web pages. This panel has three views, Network, Client Side and Web, accessed by the corresponding tabs at the top of the panel. Each view corresponds with the type of target, whether it be a computer host, user and email, or web application. See Working with Entities for more information about the Entity View Panel the new map view feature.
-
The Entity List. Displays the list of entities for the active view. If viewing the Network view, you will see your discovered hosts in this panel as well as any agents. For the Client-side view, this panel will show email addresses and, for the Web view, you can view your web pages.
-
The Executed Modules Panel. Displays information about each one of the modules, or actions that a user has performed in Core Impact. Core Impact keeps a complete log of every executed module within its database. See the section called “Using the Executed Modules View” for more information.
-
The Executed Module Info Panel. Displays information about the currently selected completed action in the Executed Modules Panel directly above it. By default this panel displays information about the last executed module. It contains three tabs: Module Output (module output report), Module Log (module log lines) and Module Parameters (module parameters at execution time). See the section called “Analyzing Module Output” for more information.
-
The Quick Information Panel. Displayed in the bottom part of the Console, the Quick Information Panel displays information about the currently selected item in the Entity View. For example, if you select a user entity, the panel displays details about that user. If you select a host, the panel displays information about that host. Refer to the section called “Entity Details” for more information about this panel.
Navigation of the Core Impact Console is straight forward - simply click among the available panels and their tabs, or use the View drop-down menu to activate or hide a console component or toolbar.
Within the View drop-down menu, you can also select from three Layouts to quickly show/hide various panels of the Core Impact Console. Choose from Classic, Wide Screen or Limited.
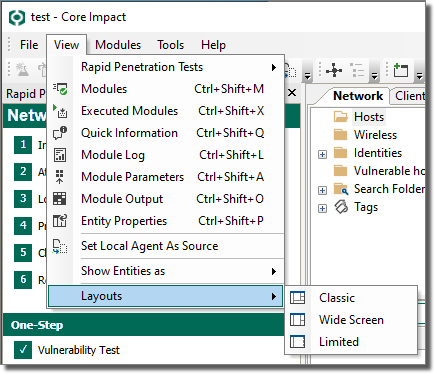
figure 3 - Layout Options