Default Panels of the Enterprise Console
The default panels of the Enterprise Console are split into:
- Alerts (Information and Inquiry)
- Devices
- Details/Action History/Messages/Command/Users
Alert panels
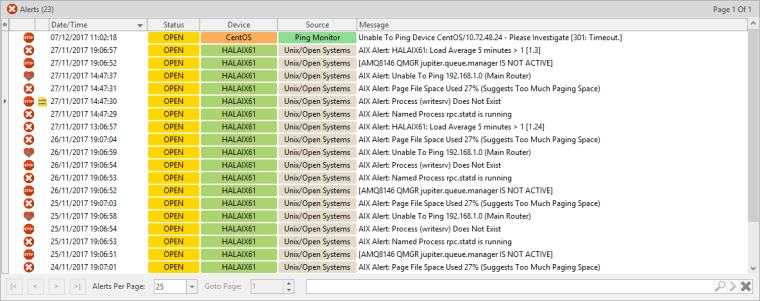
In its default format, these panels display alerts that have been directed to the panels from a Send Console Alert rule action. The default alert panels are called Inquiry and Information.
If required, the name of these panels can be changed in order to make it more meaningful. See Editing Panels for more information.
Information in this panel is displayed across the following columns.
 in the header of the far left-column of this panel to display a drop-down menu of available columns that can be displayed or hidden from view in this panel.
 Alerts
The number of alerts within this panel, that are currently held in the database, is shown in brackets in the header of this panel.
Selection Identifier
The first column is used as a secondary indicator of which alert has been selected. In addition to the alert being highlighted, a ‘>’ mark is inserted in this column against the selected alert.
Alert Type Identifier
The second column is used to display the alert type icon associated with the alert. See Alert Settings for a full list of possible icons that may be displayed in this column.
Comment Identifier
The third column is used to display ![]() Comments to indicate any alert that has a comment raised against it.
Comments to indicate any alert that has a comment raised against it.
Date/Time
Displays the date and time at which the alert was received by the Enterprise Server. See Time Zone for information regarding alerts received from remote devices in different time zones.
Status
Displays the current status of the alert. This can be one of:
- Open
- Closed
- Acknowledged
- Console
- Error
 symbol against an alert in this column signifies that the alert is an Inquiry alert. See Replying to Inquiry Alerts for more information.
Device
Displays the name of the device from which the alert was received.
Address
Displays either the device host name or IP Address dependent on how the device was defined within Device Manager. This column is hidden by default.
Description
Used to identify any device that was used to forward the alert to the Enterprise Console. See Alerts received via forwarding systems for more information. This column is hidden by default.
Source
Displays the name of the Halcyon monitor, source system or third party application that generated the alert. The following Halcyon products do not generate alerts and therefore do not interface with Enterprise Console:
- Message Communicator
- Performance Analyzer
- Spooled File Manager
- Disk Space Manager
- Authority Swapper
- Document Management System
- Record & Playback
- Exit Point Manager
- Password Reset Manager
See Source Types for more information.
Message
Displays the alert text as defined in the rule criteria that generated the alert. See Rule tab – Alert Message for more information.
Devices Panel
The Devices panel shows all the current devices that have been defined using the Device Manager.
By default, the devices are displayed in descending order by Status (i.e. those needing urgent attention are shown at the top of the list).
It is possible to change the sequence by clicking on any of the other column headings. For example, to change the sequence to display by alphabetical device name, click the Name column heading.
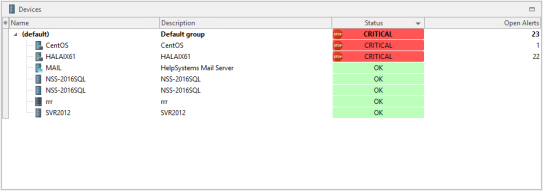
The following columns are available in the Devices panel. Left-click  in the header of the far left-column of this panel to display a drop-down menu of available columns that can be displayed or hidden from view in this panel.
Default Columns
The default columns displayed in this panel are:
Selection Identifier
The first column is used as a secondary indicator of which device has been selected. In addition to the device being highlighted, a ‘>’ mark is inserted in this column against the selected device.
Name
Displays the name of the Device Group and subsequent device within that group. Click on the arrow beside the group name to expand or hide the devices contained within the group.
Description
Displays the description attributed to each group and device listed.
Status
Shows the current status of the device. By default, devices are listed in descending order of severity depending on the number and type of alerts currently registered against the device.
Open Alerts
Displays the number of open alerts currently registered against this device.
Additional Columns
Additional columns that can be displayed in this panel are:
Devices
Displays, at Group level, the number of devices contained within the group.
Address
Displays the Host name or IP Address of each displayed device.
Object ID
Displays the Object ID attribute if the device has been defined as having SNMP Trap capability.
Connect Timeout
Displays the connection timeout period for each device.
Read Timeout
Displays the read timeout period for each device.
Alert Pct
Displays the alerts registered against groups and individual devices as a percentage figure of all open alerts.
Details/Action History/Message/Command/Users Panel
There are five different options that can be displayed within this panel. Each is accessible by clicking the relevant menu tab at the bottom of the panel.
Details Panel
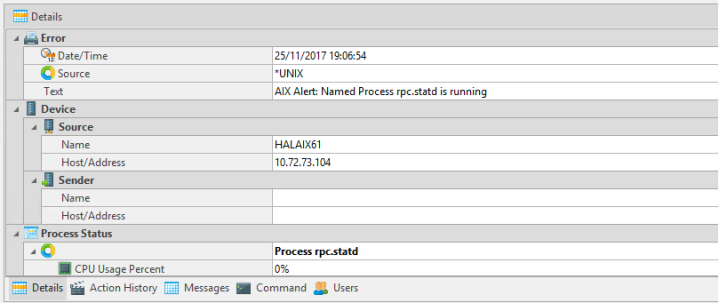
This panel has a dual purpose and can be used to display the details of any device selected from the Devices panel or the details of an alert selected from any alert panel.
For IBM i devices, this panel shows details of the following (information from other devices vary by device and operating platform):
Device
As taken from the field properties in Device Manager.
Device Information
Includes serial number, model, feature code, processor group, processors, etc.
Environment
Name and details of the Halcyon environment.
IPL Settings
Details of last IPL and other IPL settings.
Cache Battery Information
Provides details if the IBM i is equipped with cache battery.
Installed Products
Displays details of all Halcyon products installed.
When displaying alert detail, this panel commonly shows:
Alert Type
The Alert Type assigned to the alert, such as Error, Critical, etc. Sub-panels in this section show:
- Date/Time: Displays the date and time at which the alert was generated
- Source Type: Displays the source type that generated the alert
- Message: Displays the alert text
Device
Sub-panels in this section show:
- Source: Displays the Device name and Host name/IP Address of the Source device and which raised the alert.
- Sender: If the alert was routed via another device this displays the Device name and Host name/IP Address of the device which sent the alert to the Enterprise Console
Comments
This section displays any user comments that have been applied to the alert.
Status
If applicable, this section displays a snapshot of the process status at which time the alert was raised. This contents and title of this section are dependent on the process on which the rule was based.
Rule Details
Full details of the rule criteria that raised the alert.
Console
Sequence number and name details of the rule that raised this alert to the Enterprise Console
Dependent on the panel size and orientation, use the vertical scroll bar to view further details not visible in the initial display.
Action History panel
The Action History panel shows what actions have been processed against the alert since it was first logged on the Enterprise Console.

Selection Identifier
The first column is used as a secondary indicator of which action has been selected. In addition to the action being highlighted, a ‘>’ mark is inserted in this column against the selected action.
Success Identifier
Displays an icon to indicate the success of the action.
Date/Time
Displays the date and time at which the action was processed.
Status
Displays the current status of the action.
Action
Displays the type of action that was performed.
Details
Displays a full description of the action that was performed.
Messages Panel
The Messages panel shows details of any system messages that may have been generated as a result of Enterprise Console activity. The messages within this panel are consistent, regardless of the alert or device that has been selected in any other panel.
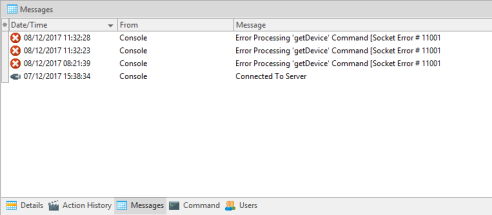
Selection Identifier
The first column is used as a secondary indicator of which action has been selected. In addition to the action being highlighted, a ‘>’ mark is inserted in this column against the selected action.
Date/Time
Displays the date and time at which the message was generated.
From
Displays the name of the device from which the message was received.
Message
Displays full text of the message.
Clear Messages
Right-click on any message from within the Messages panel and click Clear Messages to remove ALL the messages from this panel.
Command Panel
The Command panel is used to send system messages to other users.
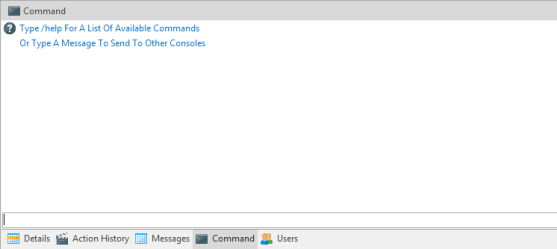
In the text box, at the bottom of this panel type /help to see a list of commands that can be sent. Alternatively, type a message that can be sent to one or more of the other console users listed in the right pane of this panel.
The following commands can be entered (commands are not case-sensitive):
- /AWAY: without message
- /AWAY AT LUNCH: with a message, for example; 'At Lunch'
- /CLS: clears the command screen
- /DATE: returns the Enterprise Server date
- /HELP: displays a list of available commands
- /LICENSE: displays licensing information
- /MSG: sends a message
- /TIME: returns the Enterprise Server time
- /VERSION: Returns the Enterprise Console version
- /PING: pings a server
- /NICK: sets the user's nickname
- /MSGTO: sends a message to a specific user (can use either the user name or nickname)
- /WHOIS: returns user info for a specified user. Can use either the user name or the nickname.
Users Panel
The Users panel displays the details of all users that have been defined for use with this Enterprise Console.

Expand the view of any user to view the following information:
- Status
- Nickname
- Last Login Date/Time
- Logged On to
- Administrator Status
